Average Sale Price Continues Upward Trend Into Spring
- Sales of homes priced higher than $1 million increased by 30 percent in the Bay Area in the first quarter, with even stronger gains in the South Bay and Silicon Valley.
- Newly constructed condominium inventory in San Francisco is at half the level from a year ago, with about 600 units on the market.
- Appreciation soared in March, with the median price in the Bay Area increasing by 19 percent year over year.
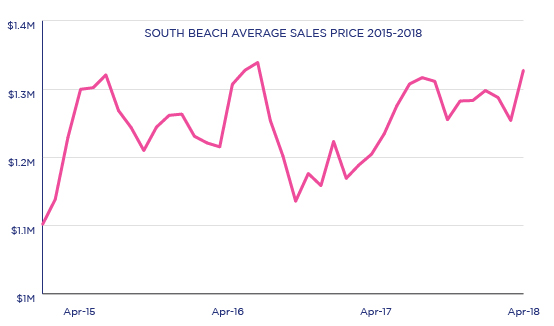
San Francisco’s District 9, which includes South Beach, Mission Bay, Rincon Hill and Yerba Buena, made the list of the Bay Area’s fastest appreciating markets. District 9 posted a median price of $1.73 million in the first quarter. South Beach in itself has an average sales price of $1.4M for condos sold, with the average price per square foot topping out at $1,269. There is strong momentum into the Spring real estate market.
Could New Home Sales Have Positive Effects on Pricing In Our Neighborhood?
In the past year, it has become commonplace to see developer condo sales data in MLS. Developer residences have a different pricing strategy and can have a positive impact on market data in MLS. I’ve broken down Q1 sales by condo type to compare pricing. Take a look at the info below and call me for any questions you may have.
The New $1 Million Dollar Condo Sold by Robyn


2018’s Q1 MLS Market Data for South Beach
| Condo Sale Type | Avg Sales Price 1BD | Avg Sales Price 2BD |
|---|---|---|
| New Condo Sales & Resales Combined | $1,057,316 | $1,812,746 |
| Condo Resales Only | $913,541 | $1,532,582 |
On just condo resales alone, the South Beach market has recorrected since 2017, with condos fetching up to 10.5% more per square foot since the beginning of 2018.
Comparing Condo Resale Pricing, Q1 2017 & Q1 2018
| 2 Bedroom Condo | Q1 2017 | Q1 2018 | % Change |
|---|---|---|---|
| Avg Sales Price | $1,422,705 | $1,532,582 | 7.7% INCREASE |
| Avg Price/Sq.Ft | $1,099 | $1,215 | 10.5% INCREASE |
| 1 Bedroom Condo | Q1 2017 | Q1 2018 | % Change |
|---|---|---|---|
| Avg Sales Price | $850,769 | $913,541 | 7.3% INCREASE |
| Avg Price/Sq.Ft | $1,074 | $1,147 | 6.8% INCREASE |
Selling Strategy in This Market
In Quarter 1 2018, South Beach data suggests that condos that sold for over listing price sold faster with less days on market. One effective strategy is to price your home at current market conditions, or under, to attract immediate buyer interest. This strategy creates an opportunity for multiple offers and effective negotiation.
| SOLD ABOVE LIST PRICE | SOLD BELOW LIST PRICE | |
|---|---|---|
| Average Days on Market | 25 | 51 |
| Average % of Sale Price Over List Price | 103% | 98% |
Mortgage Rates Down Again
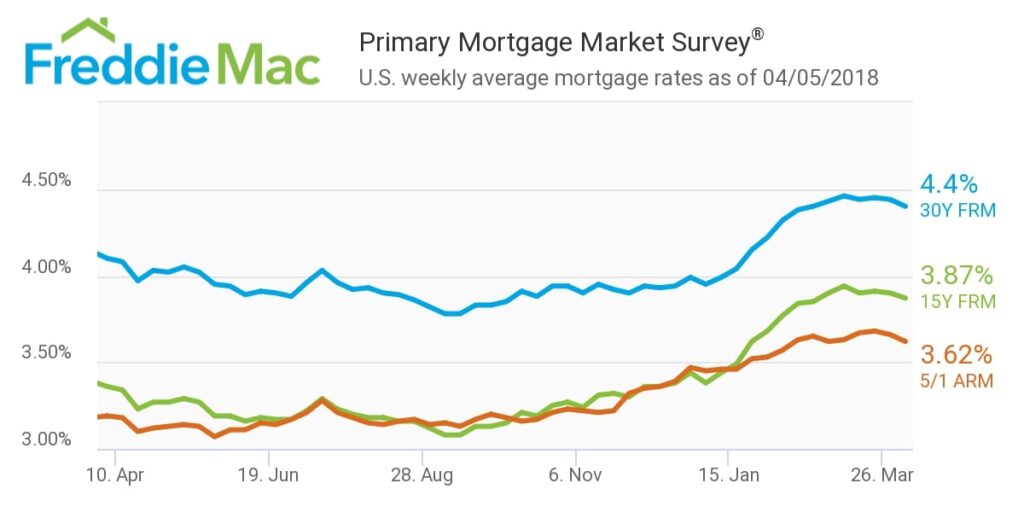
The latest numbers from Freddie Mac put the average 30-year, fixed-rate mortgage at 4.40% for the week ended April 5, down from the previous week.
From Pacific Union’s Economist Selma Hepp
Bay Area housing markets are off to a strong start in 2018, especially higher-end homes. While total year-to-date home sales numbers may suggest slower activity when compared with last year, the relative decrease is only due to fewer sales of affordable homes — those priced at less than $1 million. Generally, affordable homes have constituted the lion’s share of sales activity, but that number has been falling rapidly, from 69 percent of transactions in the first quarter of 2017 to 58 percent in the first quarter of this year. Overall, sales of homes above $1 million rose by 30 percent in the Bay Area in the first quarter, with relatively higher increases in the South Bay and Silicon Valley, but also in Sonoma and Alameda counties. Figure 1 summarizes year-to-date changes in the two price ranges across Bay Area counties.
At the same time, inventory did not improve, not even in higher price ranges, where some increases last year helped with sales activity. In March, the Bay Area’s overall supply was down by 13 percent from last year, with homes priced between $1 million and $2 million down by 2 percent; those priced between $2 million and $3 million down by 7 percent; and those over $3 million down by 3 percent. Rapidly declining inventory in the Bay Area has been an issue for more than a year now.
New-listing trends across the region in the first quarter declined by 3 percent year over year. The lack of homes for sale is particularly notable in San Francisco, where all price ranges posted fewer listings.
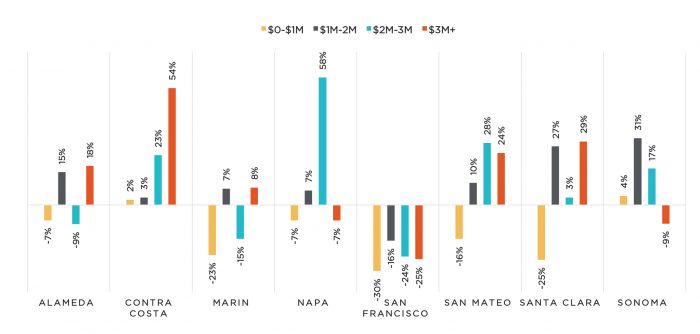
Figure 3, above, captures the quarterly year-over-year changes in listings by price ranges across Bay Area housing markets.
New-construction inventory also declined by an average of 30 percent year over year throughout 2017. After the 2016 peak, when there were 1,200 units for sale, inventory has now been cut in a half, with slightly more than 600 units available for sale.
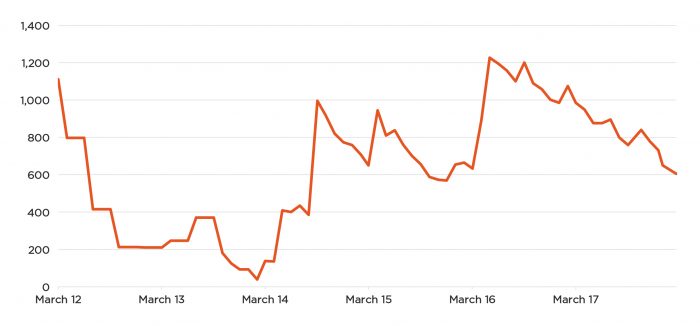
Figure 4, above, illustrates new-construction condominium inventory levels in San Francisco since 2012.
The lack homes for sale coupled with robust buyer demand once again translated into incredible median price growth, which surged by 19 percent for the Bay Area from March 2017.
Taken together, home sales activity in the Bay Area remains robust. While overall sales may be dropping, higher-priced sales are maintaining an upward momentum and growing at a rapid pace. If the first quarter is any indication of what lies ahead, the upcoming spring homebuying season will remain competitive and possibly frustrating for buyers who face increasingly higher prices and fewer homes to choose from.