Interpreting Downward & Upward Trends
Happy New Year! It’s another year to look forward to in a vibrant real estate market. Do you have plans to sell or buy this year? If you are planning to make a move, follow the real estate market closely this year in hopes to maximize your gains.

There were almost too many local, national and international political, economic, social and ecological factors impacting the 2018 market to count. In the first half of the year, market conditions were about as hot as they’ve ever been, and there were staggering year-over-year appreciation rates.
With Bay Area homes prices at its highest peak since Quarter 1 2017, buyer optimism about the housing market has settled to its lowest point in three years. Come early autumn, real estate and financial markets began to shift distinctly cooler and it has been observed that home sales have stalled.
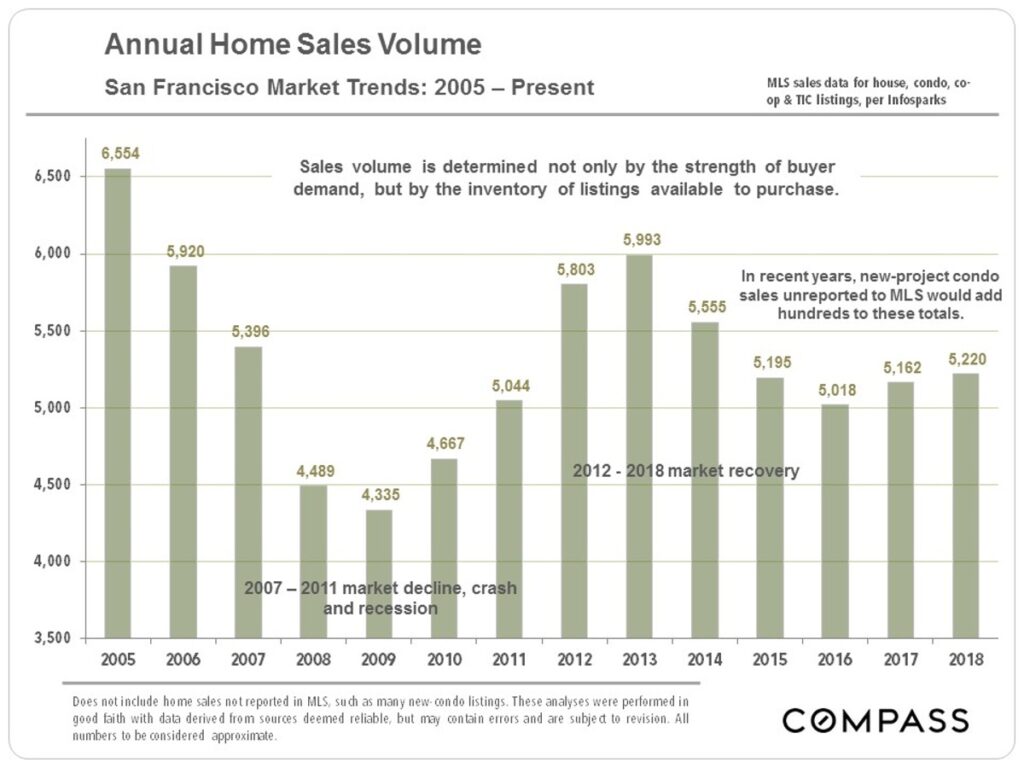
Sales fell in the past six consecutive months declining in June from 8.3% to 18.8% year-over-year in September, indicating that supply has outpaced demand with a more equitable balance between buyer and seller markets.
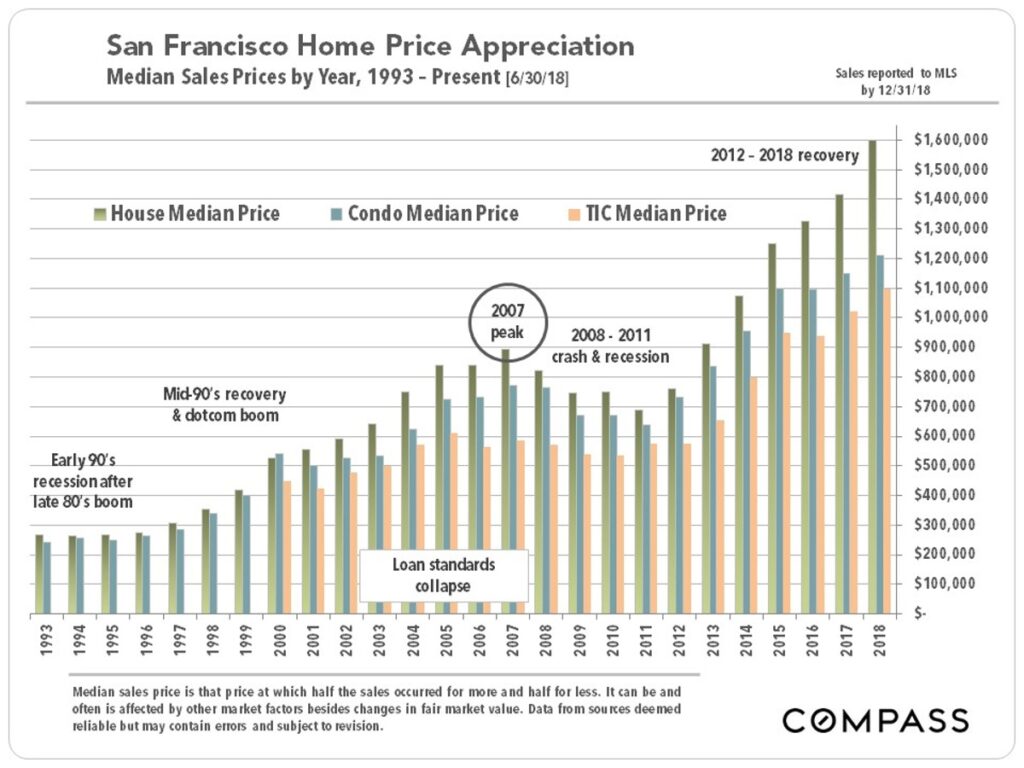
When one breaks 2018 down by quarter, it is clear that the big increases in price occurred in the first half of the year, after which the median house sales price declined. By the 4th quarter of 2018, the quarterly, year-over-year median house appreciation rate had basically dropped to zero. Condo prices were basically flat Q2 to Q4. This trend of high appreciation rates in the first half plunging during the second half was relatively common around the Bay Area.
The Silver Lining:
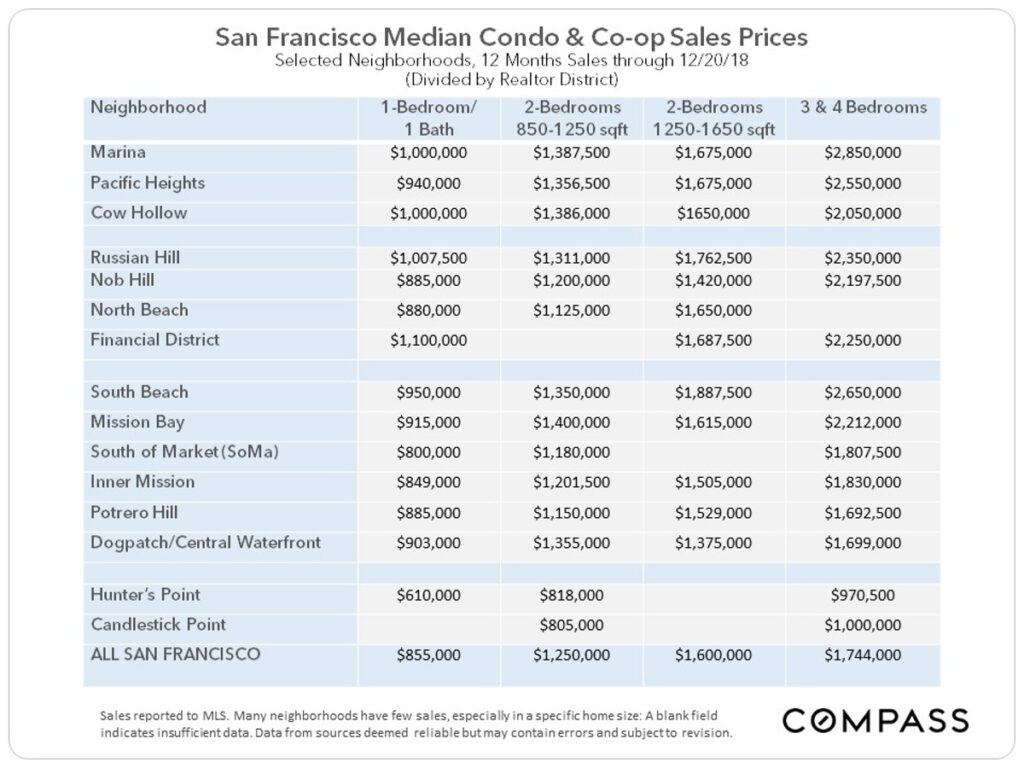
Although a trend of declining home sales dominated the last half of 2018, most recent sales data shows that prices are still up. The median price of a home in the Bay Area in November 2018 was $815,000, well up from November 2017’s average of $785,000. In South Beach, the median price for a condo in Q3 2018 was $1,245,000, relatively the same as Q3 2017’s average of $1,255,000.
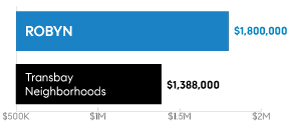
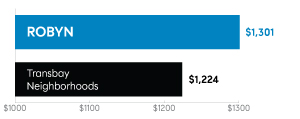
Robyn Tops Sales Records In The Neighborhood:
Robyn’s Average Sales Price, 2018
Robyn’s Average Price Per Square Foot, 2018
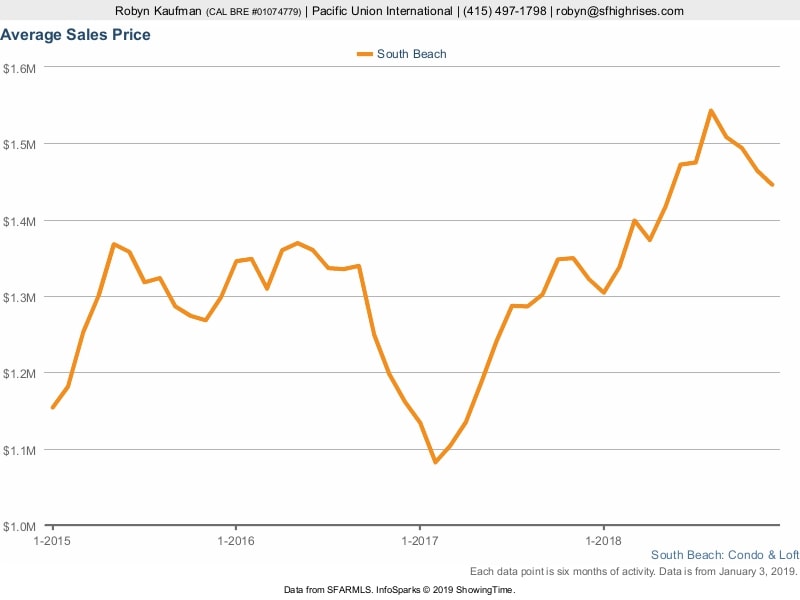
Average Sales Price in South Beach
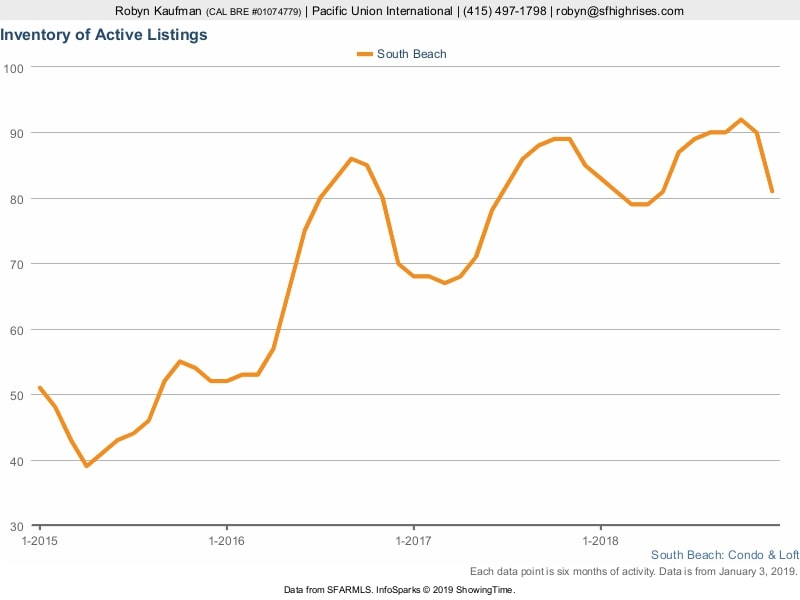
# of Active Listings in South Beach
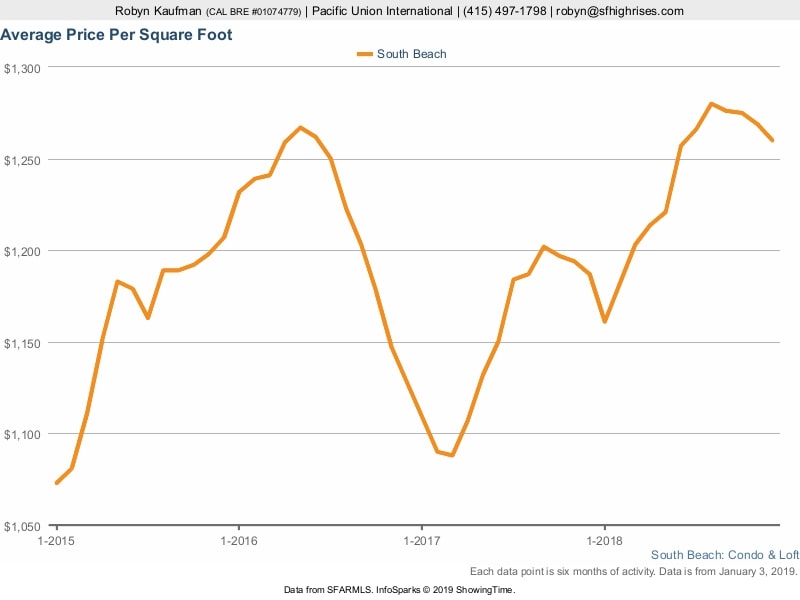
Price Per Square Foot in South Beach
Looking Forward:
Looking at 2019, there are many wild cards whose impacts are difficult to predict: extremely volatile financial markets, fluctuating interest rates, contentious national politics, international trade issues, spiraling debt levels, employment growth – and a dramatic surge of local high-tech unicorns that plan to go public, which could create a tsunami of new wealth in the Bay Area.
EquityZen, a firm operating a secondary market for stock in private, venture capitalized companies, speculates that 12 major Bay Area start-ups collectively valued at over $150 billion, may go public in 2019-including Uber, Airbnb, Palantir, Lyft and Slack.

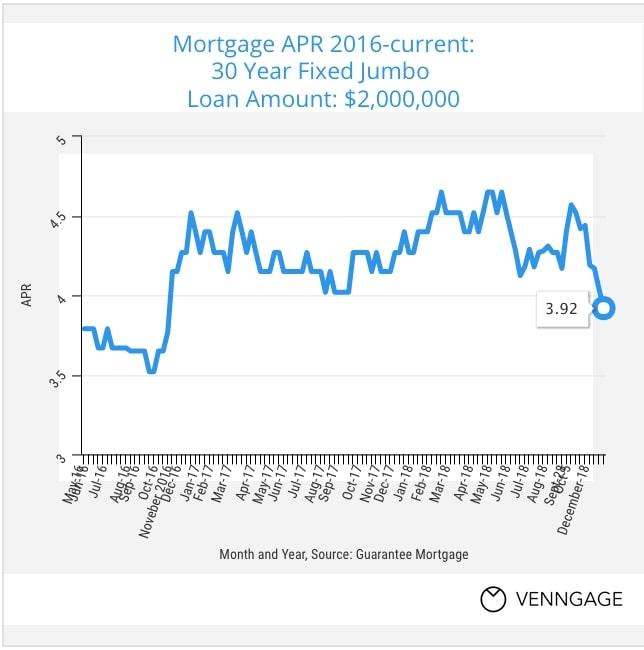
Mortgage Rates:
Rates have been steadily improving since early November. The high volatility in the markets is likely to continue as Stocks and Bonds continue to bounce around in response to the U.S. government shutdown, U.S./China tariffs, China slowdown, European issues and uncertainty around the Fed.