

Home Prices, Sales & Statistics; Stock Markets; Interest Rates and Unicorns in Spring
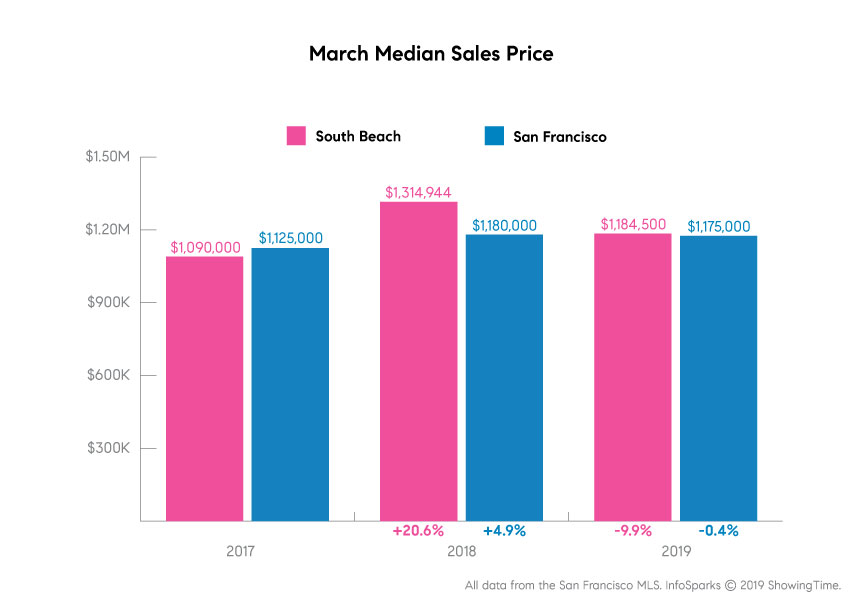
Spring is typically the season when median prices increase most. However, median house sales prices dropped dramatically from last March with a switch from high year-over-year quarterly appreciation rates to zero appreciation in the last 2 quarters. What occurs later this spring will be critical to understanding market trends.
Below are factors that continue to majorly influence consumer confidence and home-buyer demand in the current marketplace.
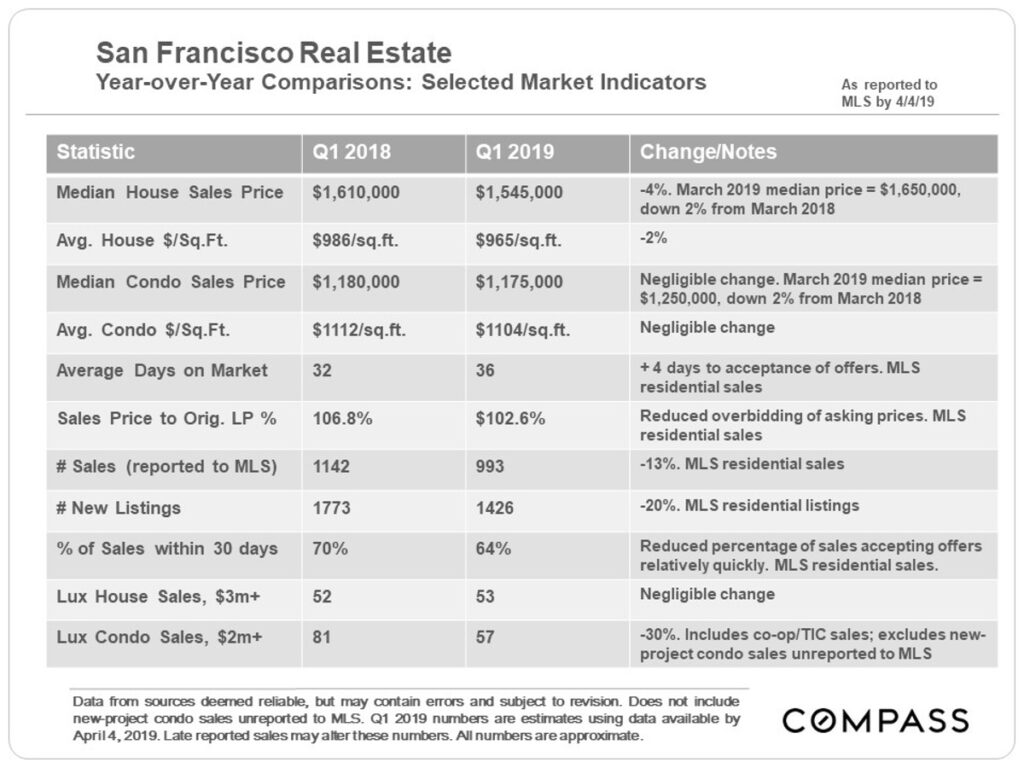
Market indicators can give us clues to where the market is headed. Citywide, there is negligible change in the median condo sales price and average price per square foot from Q1 2018 to Q1 2019. MLS also reported less real estate sales and new listings in Q1 2019 than in Q1 2018. New listings almost always climb from January through March, but not this year. Q2 will provide much more data regarding the media-frenzy “IPO effect.
New Listing Inventory
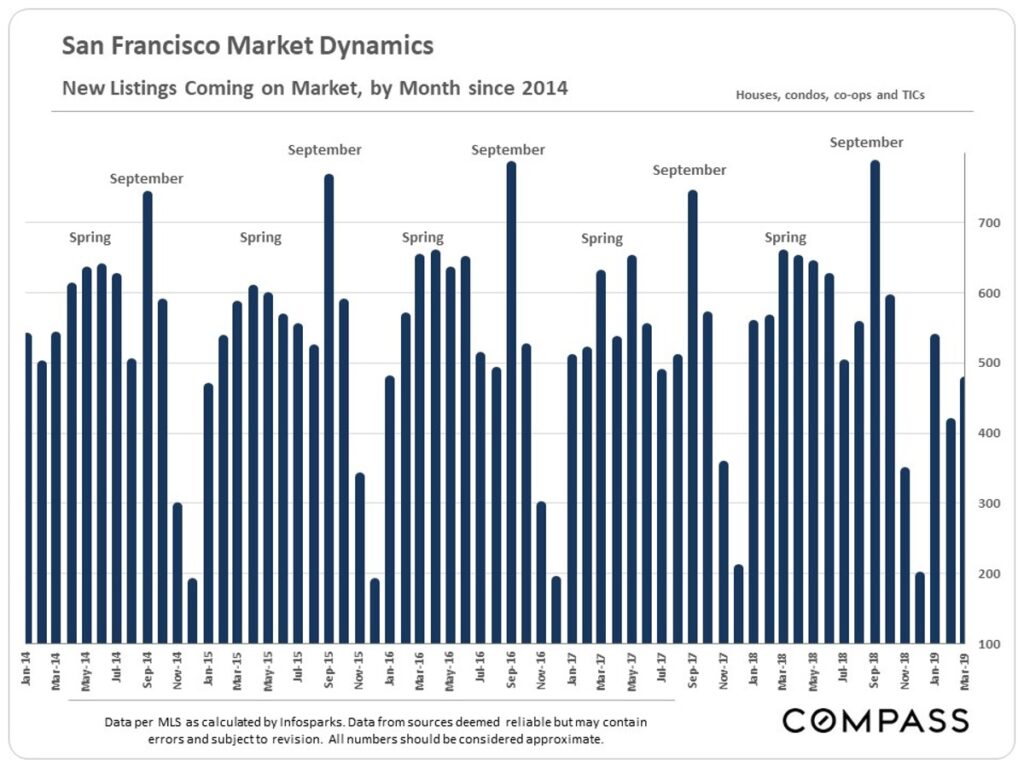
Year-over-year, there was a plunge in the number of new listings coming on market in Q1. Were sellers waiting for a hoped-for rush of new IPO millionaires to appear? Will new listing inventory jump now that the IPOs have begun to occur?
Tech Stock Price Movements
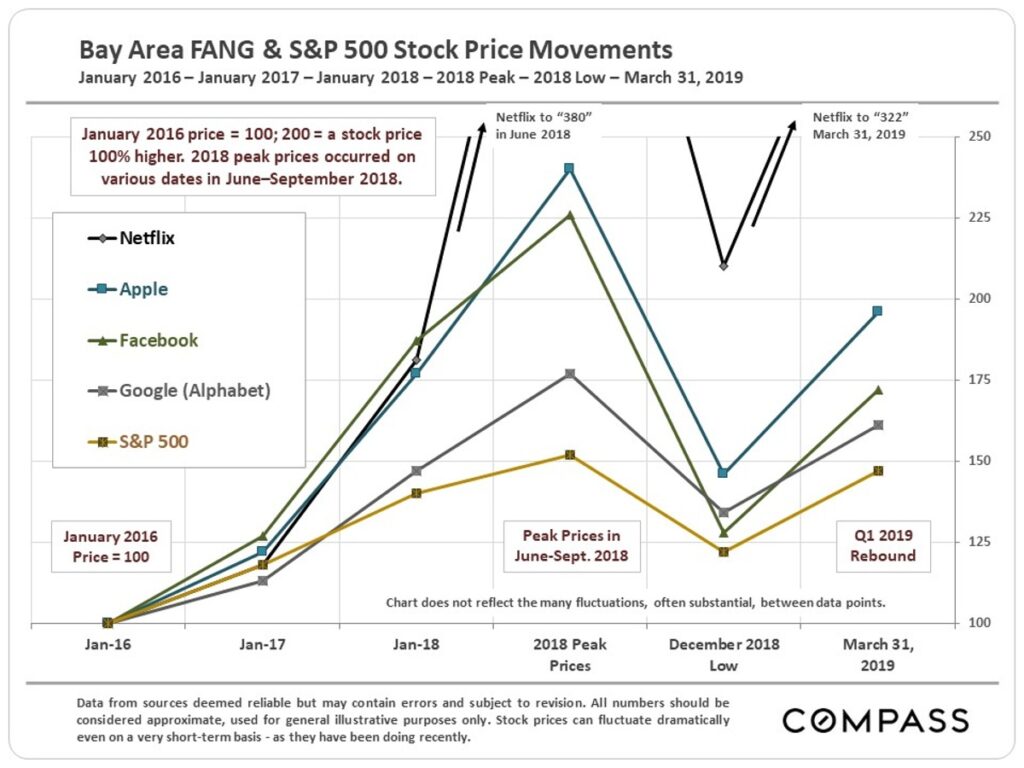
A wild ride in stock prices, particularly in high-tech: Prices soared to new peaks in summer-early autumn 2018, plunged drastically in Q4 2018, and then saw the biggest Q1 jump in 20 years. Huge amounts of wealth appearing, disappearing and reappearing – a major influence on consumer confidence and home-buyer demand.
New Condo Construction in San Francisco
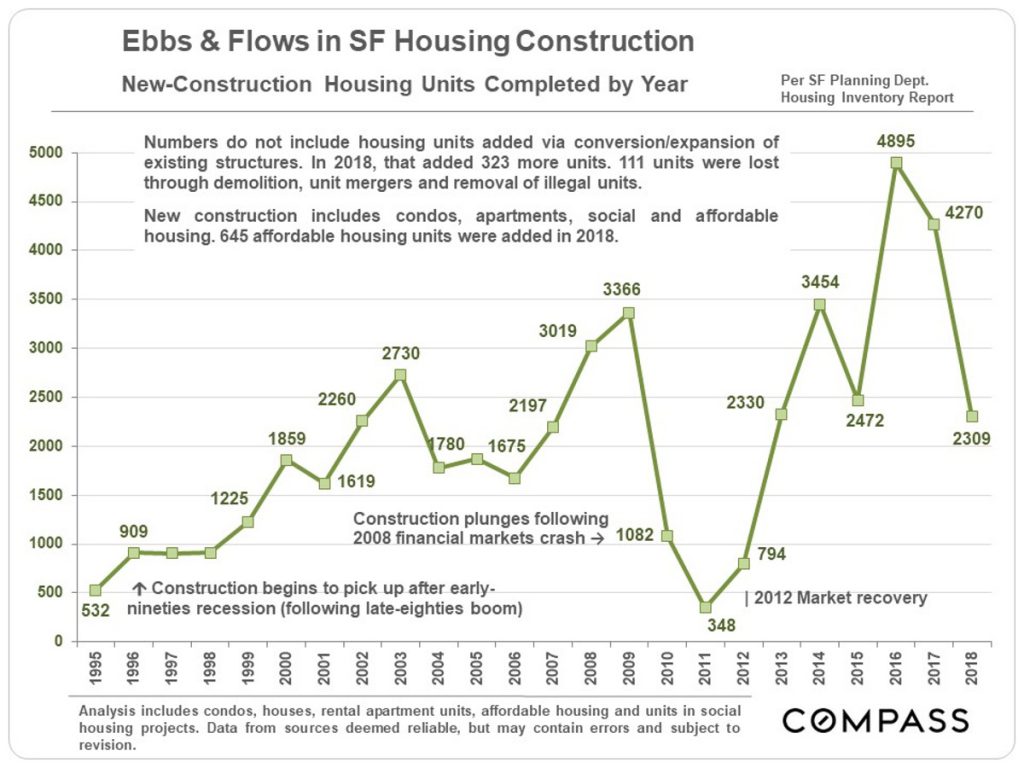
Due to a number of factors, including a rapid increase in land and construction costs, new housing construction in SF dropped dramatically in 2018. The quantity of new homes being built plays a significant role in the supply and demand equation, and thus home prices.
Declining Mortgage Rates
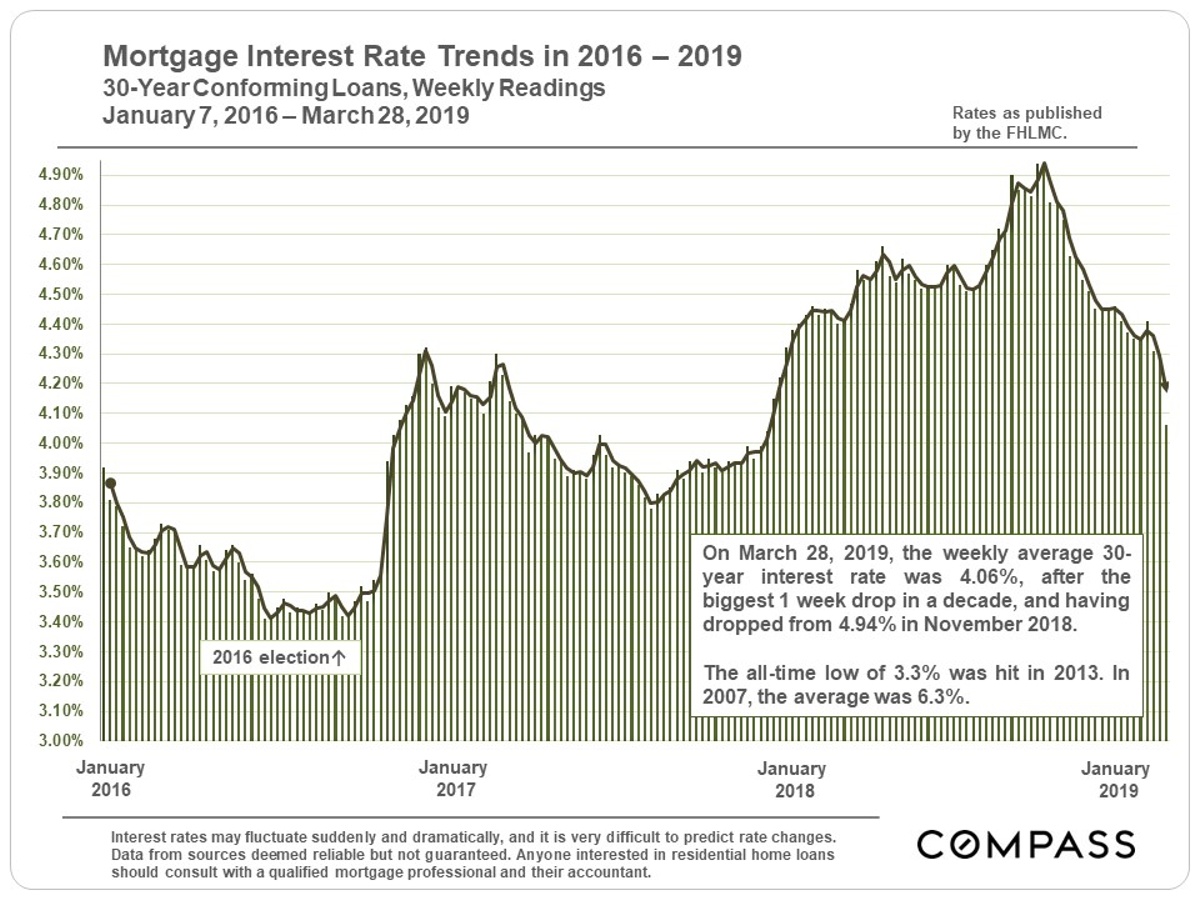
There has been a stunning decline in mortgage interest rates from mid-November 2018 through the end of March, from 4.94% to 4.06% – to the enormous advantage to buyers. Big drops such as this have helped to recharge buyer demand in the past.
What It Takes to Buy
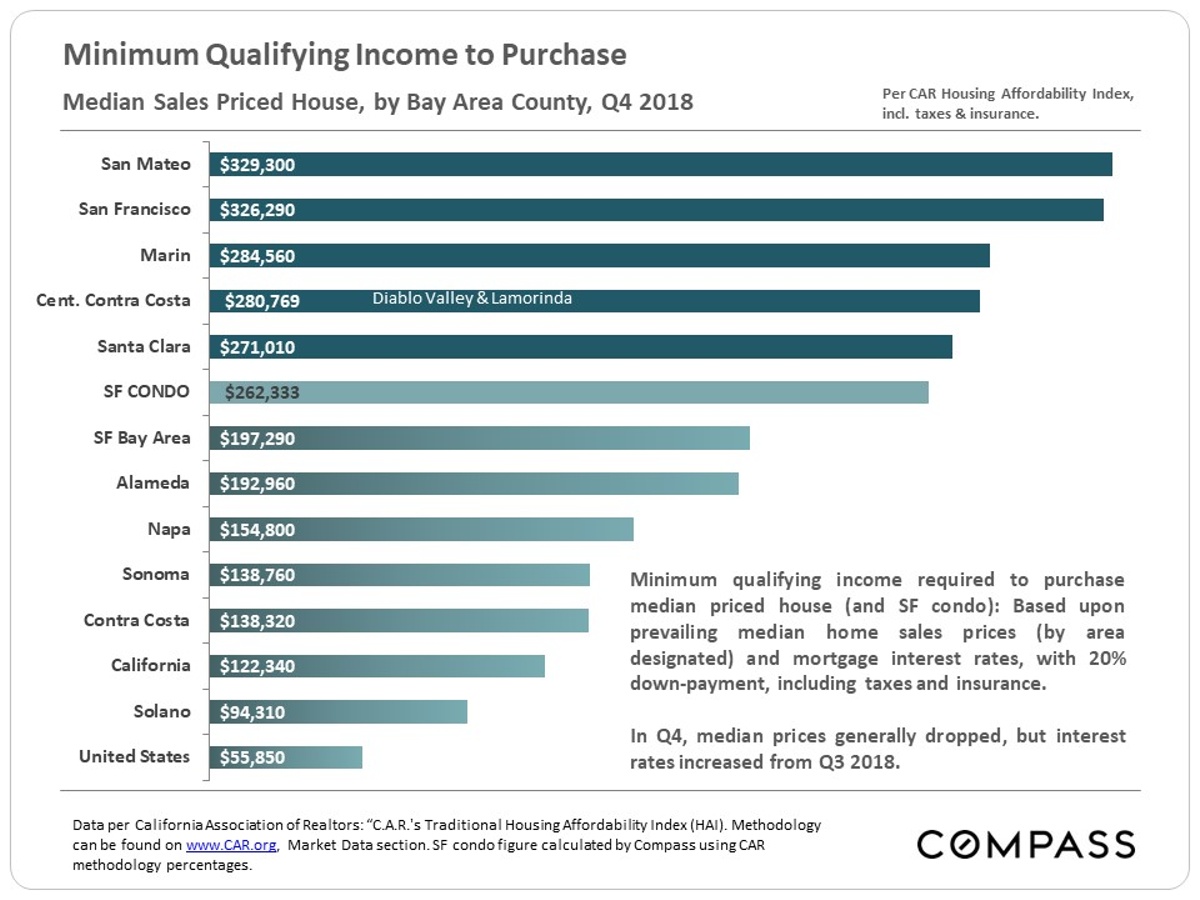
This chart calculates the income required to buy a median-price house in Q4 2018. Median condo prices are substantially less in every county and would require lower incomes.
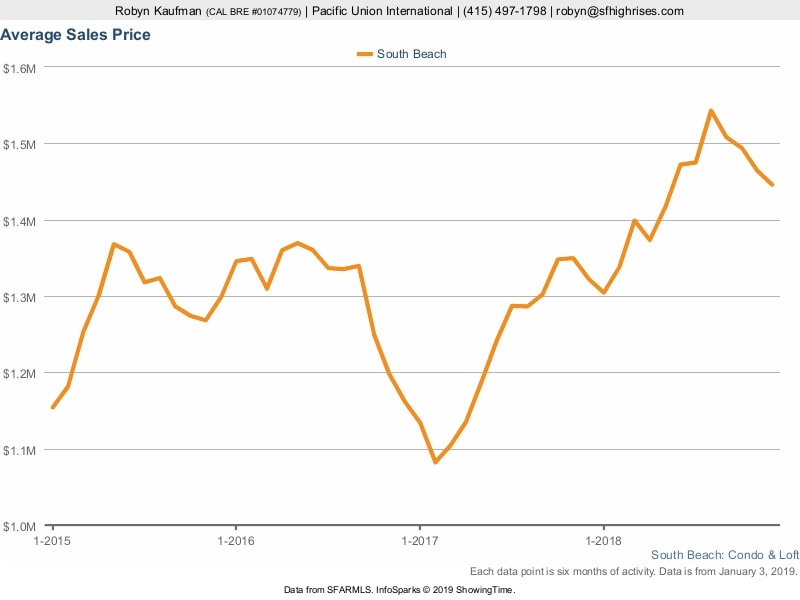
Average Sales Price in South Beach
# of Active Listings in South Beach
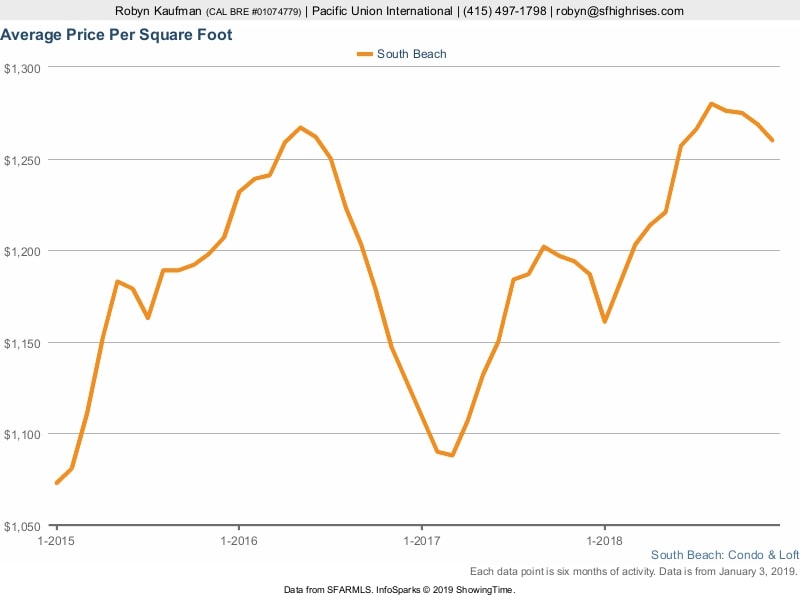
Price Per Square Foot in South Beach