Click here to view your copy of our 2019 Quarter 3 Market Report.
Is The Real Estate Market Changing?
Year-over-Year Q3 Comparisons – Q3 2016 – Q3 2019
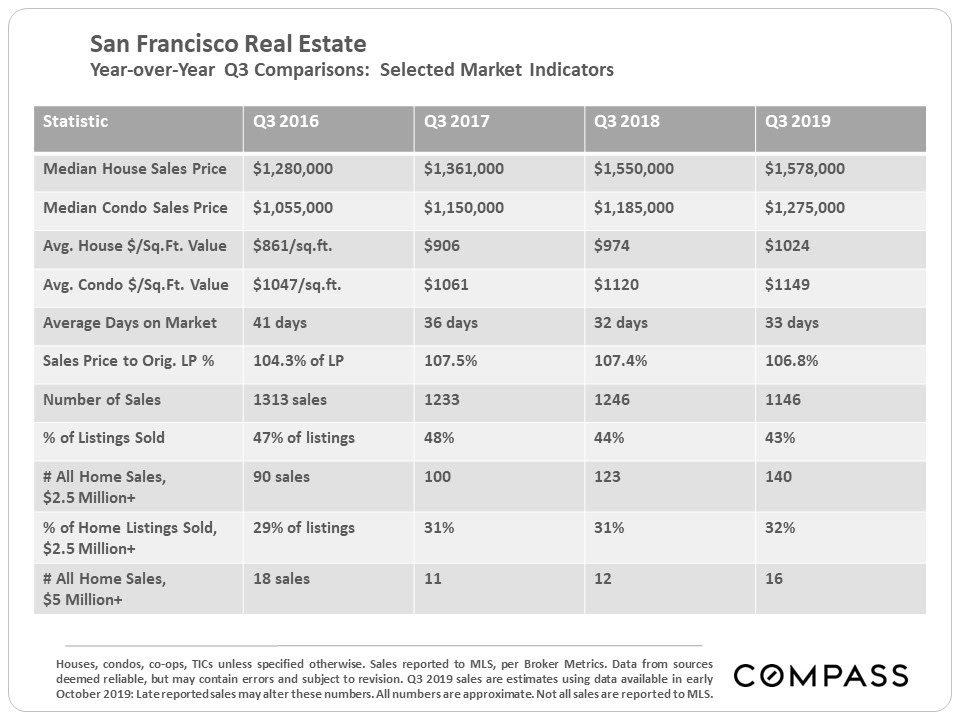
Looking back over the Q3 statistics in the past 4 years, the San Francisco market has remained quite strong, though the number of sales has declined. The “IPO effect” may well be playing a role in keeping demand up, especially in the higher price segments where sales volumes have continued to increase.
Sales Price Percentage Change
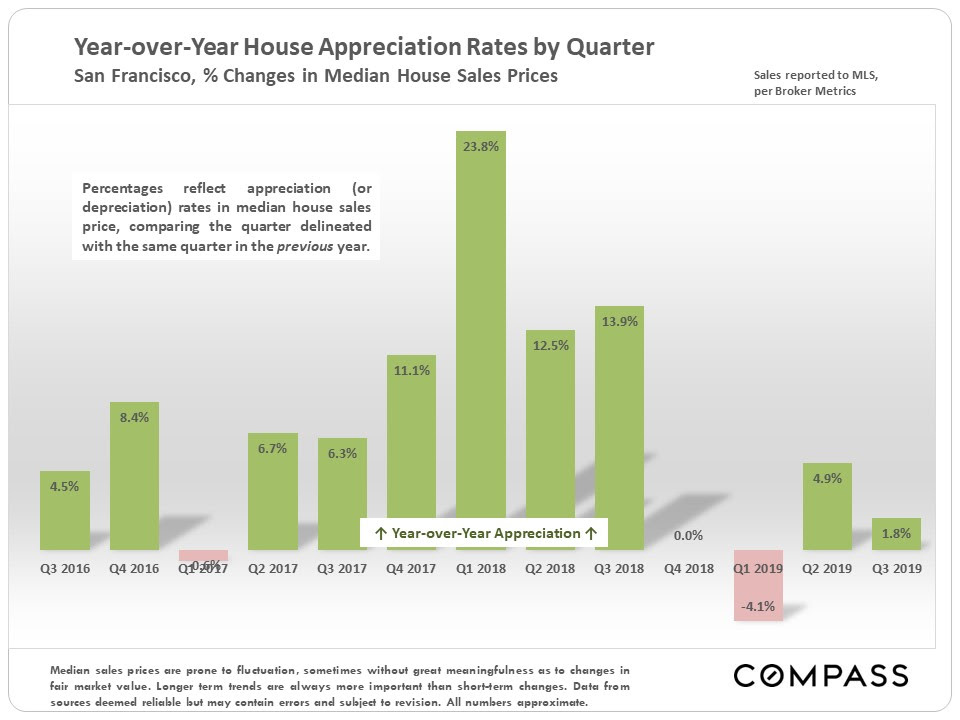
Generally speaking, San Francisco is seeing significantly better year-over-year home price appreciation rates over the past 2 quarters than most Bay Area Counties, but the increases are well down from those seen during much of the recovery since 2012.
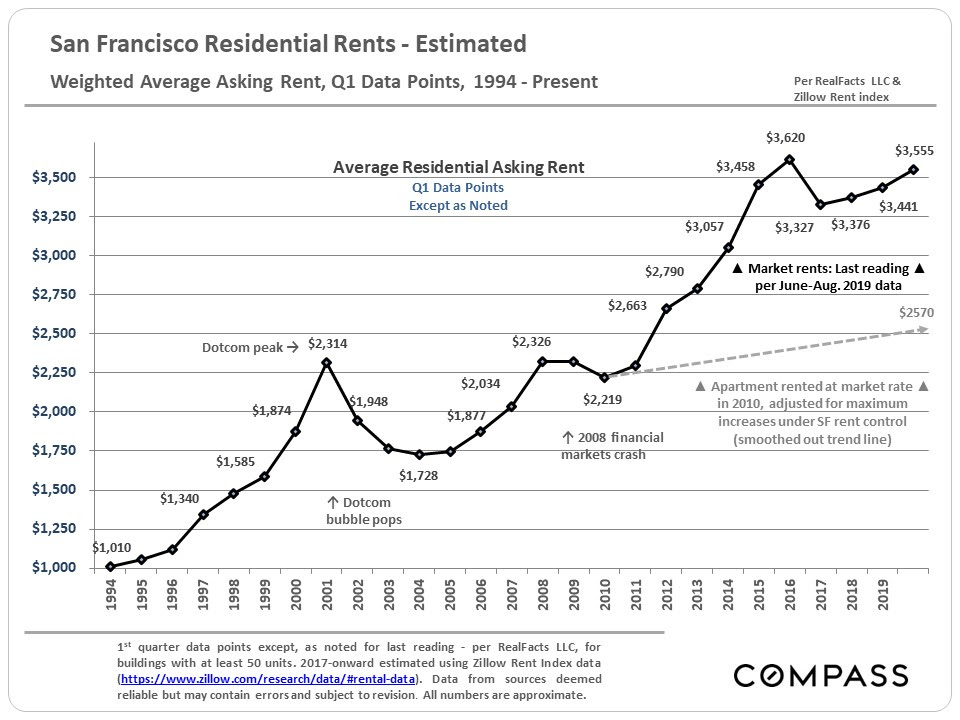
Trends in Rents
The 2 big recent factors in rent rates have been changes in employment numbers, and the increase in the supply of apartments on the market due to the boom in rental unit construction (the first such boom in many decades). Economists believe there should be generally parallel trends in rents and ownership costs, those being the 2 housing options (besides living with one’s parents).
The dotted line delineates the approximate divergence in rents between a market rate unit and a rent-controlled apartment leased in 2010.
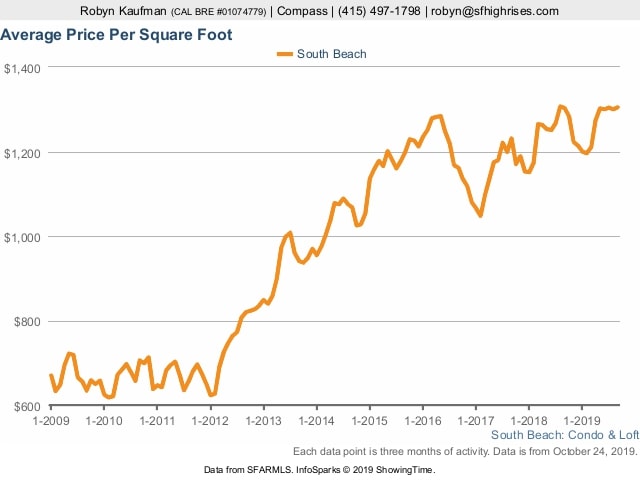
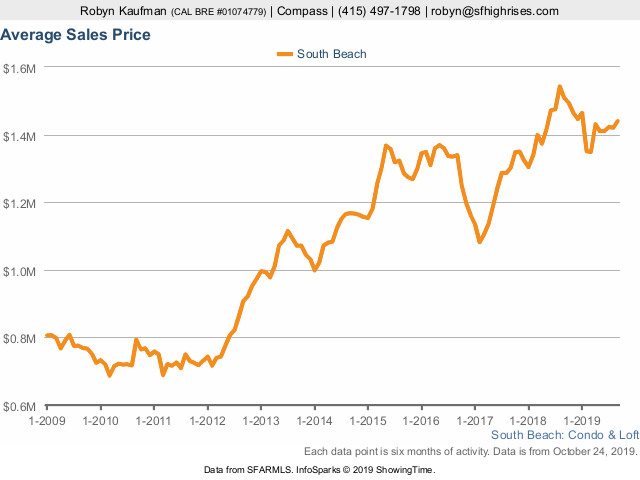
Average Sales Price in South Beach
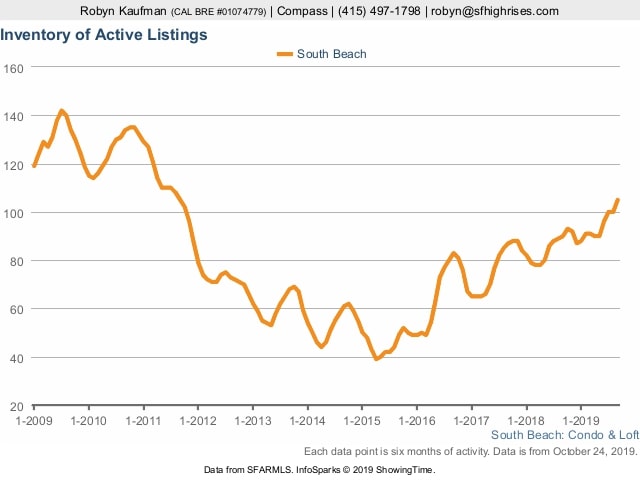
# of Active Listings in South Beach
Price Per Square Foot in South Beach