Fourth-quarter home sales activity in San Francisco picked up and condominium sales outperformed 2016’s fourth quarter and throughout 2017, especially for units priced between $2 million and $3 million. Strong buyer demand in the resale condominium market produced solid appreciation, and new condominium prices again likewise saw some upward momentum. Fewer new and existing resale condominiums were available in the fourth quarter of 2017 than in the last quarter of 2016. Buyer sentiment remained strong, and home shoppers faced stiffer competition than during the same period last year, pushing median property prices up solidly.
For single family homes, Q4 activity also increased, bringing sales to a level 5% higher than last year’s fourth quarter. Overall 2017 activity was 2% above 2016. Renewed buyer enthusiasm was particularly notable in October and November across all price ranges (with the typical seasonal slowdown in December). As with condo inventory, the same dismal for-sale inventory levels that characterized most of 2017 persisted — especially for affordable homes.
Looking Forward: Strong housing fundamentals and the Bay Area’s economic growth will continue to feed buyer demand. Early year’s homebuyer traffic reports suggest that the first quarter will carry over renewed momentum in San Francisco housing markets despite some trepidation over the impacts of the tax reform.
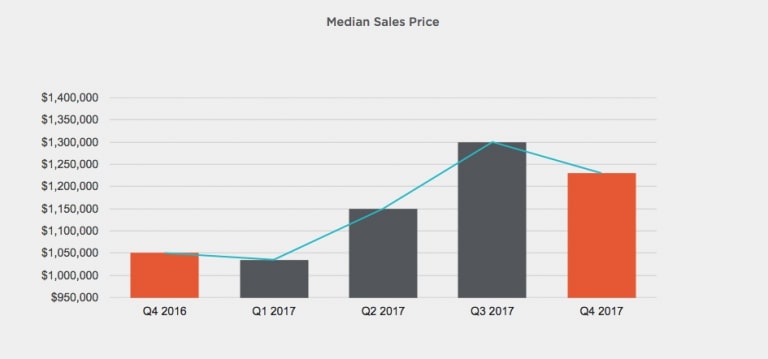
Condo Prices are up 17.1% in South Beach
Get more stats from Pacific Union’s Q4 quarterly report. For more information on what’s is affecting San Francisco’s Real Estate Market, read more on our housing prediction blog here.
South Beach Real Estate Trends
Condo Sales with The Highest Price Per Square Foot
| ADDRESS | BUILDING | DOM | $/SQ FT | SALE PRICE | BD/BA |
| 301 Main St #19G | The Infinity | 136 | $1,266 | $960,000 | 96% |
| 333 1st St #1605 | The Metropolitan | 42 | $1,234 | $875,000 | 1BD/1BA |
| 425 1st St #6002 | One Rincon Hill | 368 | $1,619 | $2,470,000 | 3/2 |
| 425 1st St #5302 | One Rincon Hill | 77 | $1,415 | $2,778,800 | 2/2.5 |
| 425 1st St #5404 | One Rincon Hill | 72 | $1,431 | $1,805,000 | 2/2 |
| 1 Hawthorne #PH25A | One Hawthorne | 170 | $1,353 | $2,200,000 | 2/2 |
| 1 Hawthorne #21F | One Hawthrone | 74 | $1,408 | $1,950,000 | 2/2 |
| 501 Beale #12D | Watermark | 138 | $1,505 | $1,895,000 | 2/2 |
| 219 Brannan #18A | The Brannan | 61 | $1,780 | $3,000,000 | 3/2 |
Sales Highlights in San Francisco Condo Buildings
- Sales at The Metropolitan performed extremely well. In 2017, there were 16 sales at The Metropolitan. Condos took an average of 28 days to sell. The price per square foot ranged from $1,124-$1,332.
- Sales at One Rincon Hill were also outstanding. The average sales price in 2017 was $1,658,457. Although it on average 76 days to sell a unit, the price per square foot ranged from $1,047-$1,967.
- At The Watermark in 2017, there were 8 sales. The average sales price in 2017 was $1,673,563, and condos took an average of 55 days to sell. The price per square foot ranged from $1,056-$2,178.
- The Brannan also saw some record sales. In 2017, there were 13 sales at The Brannan. The average sales price in 2017 was $1,702,308, and condos took an average of 31 days to sell. The price per square foot ranged from $1,034-$1,930.
Sell Your Home For The Price You Want
Do you want to know the price of condo residences in your building? We are offering you our comprehensive 2017 sales report for our neighborhood’s highrise residences. Fill out the form below the print version or view online at SFCONDOMARKETREPORT.COM